Bairros de João Pessoa
Contents
Bairros de João Pessoa#
import warnings
warnings.filterwarnings('ignore')
import pandas as pd
import geopandas as gpd
import matplotlib.pyplot as plt
from matplotlib.offsetbox import AnchoredText
Lendo de geodata-jp#
bairros = gpd.read_file('https://raw.githubusercontent.com/paulovitorweb/geodata-jp/main/data/bairros.geojson')
bairros.info()
<class 'geopandas.geodataframe.GeoDataFrame'>
RangeIndex: 64 entries, 0 to 63
Data columns (total 7 columns):
 #   Column     Non-Null Count  Dtype
---  ------     --------------  -----
 0   cod        64 non-null     object
 1   nome       64 non-null     object
 2   perimetro  64 non-null     float64
 3   area       64 non-null     float64
 4   hectares   64 non-null     float64
 5   densidade  9 non-null      object
 6   geometry   64 non-null     geometry
dtypes: float64(3), geometry(1), object(3)
memory usage: 3.6+ KB
bairros.head()
| cod | nome | perimetro | area | hectares | densidade | geometry | |
|---|---|---|---|---|---|---|---|
| 0 | 24 | ERNESTO GEISEL | 6650.895993 | 1.905707e+06 | 190.570736 | None | POLYGON ((-34.86412 -7.17066, -34.86447 -7.170... |
| 1 | 11 | BESSA | 6362.909869 | 2.040910e+06 | 204.091004 | 0,000000000 | POLYGON ((-34.84627 -7.07684, -34.84493 -7.076... |
| 2 | 02 | AEROCLUBE | 6436.704571 | 2.058472e+06 | 205.847186 | 0,000000000 | POLYGON ((-34.84435 -7.09790, -34.84342 -7.097... |
| 3 | 35 | JARDIM OCEANIA | 7344.368535 | 2.280272e+06 | 228.027235 | 0,000000000 | POLYGON ((-34.83775 -7.09747, -34.83331 -7.097... |
| 4 | 38 | MANAÍRA | 6610.028055 | 2.299794e+06 | 229.979426 | 0,000000000 | POLYGON ((-34.83043 -7.11329, -34.82384 -7.110... |
Excluindo alguns campos#
bairros = bairros.drop(columns=['perimetro', 'area', 'hectares', 'densidade'])
bairros.head()
| cod | nome | geometry | |
|---|---|---|---|
| 0 | 24 | ERNESTO GEISEL | POLYGON ((-34.86412 -7.17066, -34.86447 -7.170... |
| 1 | 11 | BESSA | POLYGON ((-34.84627 -7.07684, -34.84493 -7.076... |
| 2 | 02 | AEROCLUBE | POLYGON ((-34.84435 -7.09790, -34.84342 -7.097... |
| 3 | 35 | JARDIM OCEANIA | POLYGON ((-34.83775 -7.09747, -34.83331 -7.097... |
| 4 | 38 | MANAÍRA | POLYGON ((-34.83043 -7.11329, -34.82384 -7.110... |
Transformando para coordenadas métricas#
bairros = bairros.to_crs('EPSG:31985')
bairros.crs
<Projected CRS: EPSG:31985>
Name: SIRGAS 2000 / UTM zone 25S
Axis Info [cartesian]:
- E[east]: Easting (metre)
- N[north]: Northing (metre)
Area of Use:
- name: Brazil - between 36°W and 30°W, northern and southern hemispheres, onshore and offshore.
- bounds: (-36.0, -23.8, -29.99, 4.19)
Coordinate Operation:
- name: UTM zone 25S
- method: Transverse Mercator
Datum: Sistema de Referencia Geocentrico para las AmericaS 2000
- Ellipsoid: GRS 1980
- Prime Meridian: Greenwich
Calculando área dos bairros#
bairros['area_km2'] = bairros['geometry'].area / 1000000
bairros.head()
| cod | nome | geometry | area_km2 | |
|---|---|---|---|---|
| 0 | 24 | ERNESTO GEISEL | POLYGON ((294146.208 9206966.635, 294107.367 9... | 1.905748 |
| 1 | 11 | BESSA | POLYGON ((296077.112 9217351.507, 296224.360 9... | 2.040906 |
| 2 | 02 | AEROCLUBE | POLYGON ((296297.729 9215023.713, 296400.444 9... | 2.059346 |
| 3 | 35 | JARDIM OCEANIA | POLYGON ((297027.067 9215073.395, 297518.007 9... | 2.278178 |
| 4 | 38 | MANAÍRA | POLYGON ((297843.051 9213327.092, 298569.251 9... | 2.302670 |
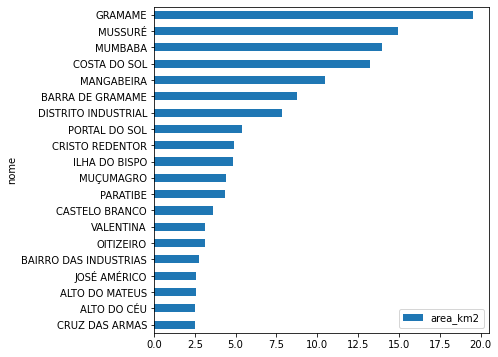
Plotando gráficos#
bairros.sort_values(by='area_km2')[-20:].plot.barh(x='nome', y='area_km2', figsize=(6,6))
<AxesSubplot:ylabel='nome'>
Plotando mapas#
def _insert_title(title, ax):
at = AnchoredText(title, prop={'size':11}, frameon=True, loc='upper left')
at.patch.set_boxstyle('square,pad=0.1')
ax.add_artist(at)
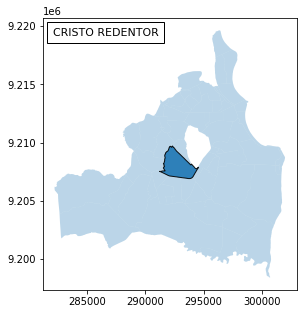
def plot(bairro_nome):
fig, ax = plt.subplots(1, 1, figsize=(5,5))
_insert_title(bairro_nome, ax)
bairros.plot(ax=ax, alpha=0.3, zorder=1)
bairros[bairros['nome'] == bairro_nome].plot(ax=ax, alpha=0.9, edgecolor='k', zorder=2)
plot('CRISTO REDENTOR')
Adicionando anotação ao mapa#
def _insert_data(data, ax):
x, y, arrow_length = 0.025, 0.89, 0.03
ax.annotate(data, xy=(x, y), xytext=(x, y-arrow_length),
ha='left', va='center', fontsize=10,
xycoords=ax.transAxes)
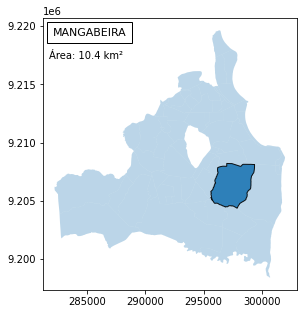
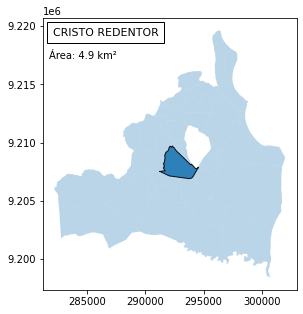
def plot(bairro_nome):
mask = bairros['nome'] == bairro_nome
fig, ax = plt.subplots(1, 1, figsize=(5,5))
_insert_title(bairro_nome, ax)
bairro = bairros[mask]
area = round(float(bairro.iloc[0]['area_km2']), 1)
data = 'Área: ' + str(area) + ' km²'
_insert_data(data, ax)
bairros.plot(ax=ax, alpha=0.3, zorder=1)
bairro.plot(ax=ax, alpha=0.9, edgecolor='k', zorder=2)
plot('CRISTO REDENTOR')
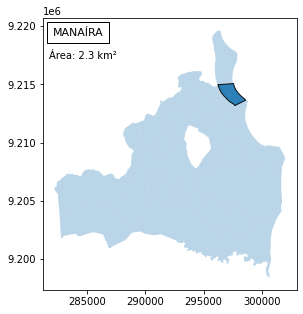
plot('MANAÍRA')
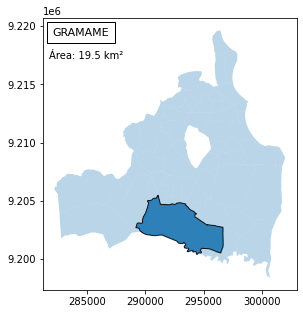
plot('GRAMAME')
plot('MANGABEIRA')